Newman Lake 2012 Water Quality Monitoring Report
Washington State University's report on Newman Lake for 2012 found clear water and few cyanobacteria, but a season's phosphorus of 34 µg/L, against a target of about 20.
Details
Summary
Clear Water, but Oxygen Outages
Compressor overheating caused oxygenation outages in July and August, when sediment oxygen demand peaks, and bottom oxygen fell below 1 mg/L (pp. 2, 3).
Key Figures
34µg/L
Volume-weighted total phosphorus for the 2012 season Source: PDF page 2 (opens in a new tab)
36µg/L
Volume-weighted total phosphorus for 2011 Source: PDF page 2 (opens in a new tab)
20µg/L
Target total phosphorus for Newman Lake (about) Source: PDF page 2 (opens in a new tab)
Questions
What dissolved oxygen should be kept at the bottom of a lake to control phosphorus?
The report says ideally more than about 4 mg/L in the bottom water, but above 2 mg/L at the sediment surface is enough to reduce internal phosphorus loading (p. 3).
What is a lake's anoxic factor?
An index of how long and over how much of the lake bed the bottom water lacks oxygen in a season, in days. Temperate lakes with anoxia problems typically score about 20 to 70 days (p. 3).
Why did Newman Lake's phosphorus rise in 2012?
The authors link it to more anoxia after compressor outages in July and August, without claiming cause and effect, and say higher summer runoff may also have played a role (pp. 2, 3).
Did Newman Lake have cyanobacteria blooms in 2012?
No significant ones. Diatoms dominated, and with nitrogen to phosphorus ratios averaging about 11, phosphorus still limited the algae. The authors still warn that rising phosphorus could lead to cyanobacteria blooms (pp. 2, 3, 4).
How do you keep a lake oxygenation system running through the summer?
The report recommends frequent checks and fast restarts after any shutdown, major maintenance in winter, and telemetered monitoring of the compressors at modest cost (p. 4).
How was Newman Lake's water quality in 2012?
Generally good for clarity and algae, with Secchi depths up to 4 m and diatoms rather than cyanobacteria dominating. Total phosphorus was higher, with a seasonal volume-weighted value of 34 µg/L against a target of about 20 µg/L. (PDF page 2) (opens in a new tab)
Why did bottom oxygen drop in 2012?
Compressor overheating caused oxygenation outages in July and August, when sediment oxygen demand is highest. Oxygen inputs fell below what the sediment needed, and bottom D.O. dropped below 1 mg/L at 6 m and deeper in late July. (PDF page 3) (opens in a new tab)
Has hypolimnetic oxygenation worked at Newman Lake?
Yes. It began in 1992, and once the system ran full time from about 2001 the anoxic factor stayed below 10 days, reaching 0 days in 2005 and from 2007 to 2010. The authors say the system can maintain enough oxygen to reduce internal phosphorus loading. (PDF page 3) (opens in a new tab)
What do the authors recommend?
Run the system at full capacity for the whole stratified period because it has little spare capacity, monitor it often and restart quickly after shutdowns, do major maintenance in winter, consider remote monitoring of the compressors, and keep some alum in reserve for summer. (PDF page 4) (opens in a new tab)
Is phosphorus still the limiting nutrient?
Yes. Total nitrogen to total phosphorus ratios averaged about 11 for the season, above the roughly 7 that would signal a shift to nitrogen limitation. (PDF page 4) (opens in a new tab)
The Project
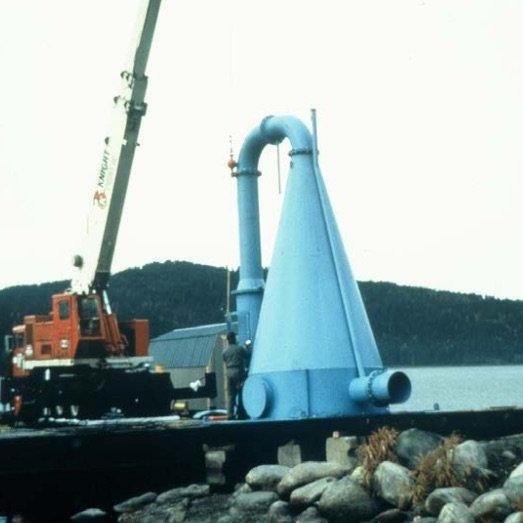
Newman Lake
In Full
More Key Figures
12 more, each with what it measures and its PDF page.
From the PDF
| Figure | What It Measures |
|---|---|
| 4 m | Highest mid-summer Secchi depth (water clarity) (PDF page 2 (opens in a new tab)) |
| 1992 | Year hypolimnetic oxygenation began at Newman Lake (PDF page 3 (opens in a new tab)) |
| 10 days | Anoxic factor since 2001, when the system ran full time (lower than) (PDF page 3 (opens in a new tab)) |
| 1 mg/L | Bottom D.O. at 6 m and deeper in late July 2012, during compressor outages (less than) (PDF page 3 (opens in a new tab)) |
| 11 TN/TP ratio | Seasonal nitrogen to phosphorus ratio, showing phosphorus still limits algae (about) (PDF page 4 (opens in a new tab)) |
| 34 µg/L | Volume-weighted total phosphorus, 2012 season, against a target of about 20 (PDF page 2 (opens in a new tab)) |
| 36 µg/L | Volume-weighted total phosphorus, 2011 season (PDF page 2 (opens in a new tab)) |
| 4 m | Highest mid-summer Secchi depth, 2012 (PDF page 2 (opens in a new tab)) |
| Below 1 mg/L | Bottom dissolved oxygen at 6 m and deeper, late July 2012 (PDF page 3 (opens in a new tab)) |
| Below 10 days | Anoxic factor from 2001, once the system ran full time (PDF page 3 (opens in a new tab)) |
| 19 days | Anoxic factor in 2012 (about) (PDF page 3 (opens in a new tab)) |
| 11 TN:TP | Season's average nitrogen to phosphorus ratio (about); below about 7 would mean nitrogen limits algae (PDF page 4 (opens in a new tab)) |
The Full Write-Up
The problem, the work, the results and who did it.
A Lake Managed for Phosphorus, with Oxygen at the Sediment
Newman Lake's sediment recycles phosphorus when the bottom water loses its oxygen. Hypolimnetic oxygenation was put in to stop that, and by 2012 it was a major part of the lake's restoration and management. Operational and environmental limits kept the system from its full potential until about 2001, when the lake's phosphorus began a downward trend (p. 3). By 2012 the authors counted over 20 years of experience with it (p. 4).
The lake's target for total phosphorus has been about 20 µg/L, and at least half the values of the past 12 years met it (p. 2). Ideally the bottom water holds more than about 4 mg/L of oxygen, but above 2 mg/L at the sediment surface is enough to reduce internal phosphorus loading (p. 3).
The authors track this with Nurnberg's anoxic factor, a widely used index, in days, of how long and how widely a lake's bottom water lacks oxygen. Temperate lakes with anoxia problems typically score about 20 to 70 days (p. 3).
A Season of Sampling at the Usual Stations
The 2012 sampling used the same stations and methods as earlier years (p. 2). It covered water clarity, phosphorus and nitrogen, dissolved oxygen profiles, algae, pH and alkalinity, zooplankton and bottom invertebrates (pp. 2, 3, 4). Table 1 gives nitrogen to phosphorus ratios for the north, middle and south of the lake at three depths (p. 10).
The report sets the season against the lake's record: phosphorus over the past 12 years, anoxic factors from 1986, and algae biomass from 1986 through 2012 (pp. 2, 3, 7). It also notes that oxygen transfer in Speece Cones® depends strongly on the oxygen and water flow rates (p. 3).
Clear Water & Diatoms, but Anoxia in Late July & More Phosphorus
Clarity and algae were good. Secchi depth ranged from 1.5 m at spring and fall turnover to about 3 to 4 m in late July and early August. Diatoms dominated the summer algae, with little cyanobacteria (p. 2).
Phosphorus was higher. The season's volume-weighted total phosphorus was 34 µg/L, after 36 in 2011; before 2011, the last year above 30 was 2000. Samples ranged from 19 to 64 µg/L, and 61% fell between 31 and 50 µg/L (p. 2).
Bottom oxygen held above the 2 mg/L minimum until late July, then fell below 1 mg/L at 6 m and deeper. Compressor overheating had caused outages in July and August, typically the period of maximum sediment oxygen demand, so oxygen inputs fell below what the sediment needed (p. 3).
From 2001 the anoxic factor stayed below 10 days, and it was 0 days in 2005 and from 2007 to 2010. In 2012 it was about 19 days. The authors note that it rose with phosphorus over the last two years, without claiming cause and effect, and that higher runoff, seen at nearby Liberty Lake too, may have added phosphorus (pp. 2, 3). Nitrogen to phosphorus ratios averaged about 11, above the roughly 7 that would mean nitrogen limits the algae (p. 4).
Written by Washington State University for the Lake's District
Barry C. Moore, Andrew Child, Benjamin Cross, Amy Martin, Ellen Preece and Megan Skinner of the School of the Environment at Washington State University, Pullman, wrote the report for the Newman Lake Flood Control Zone District. It is dated February 2013 (p. 1). It builds on Moore and colleagues' 2012 case study of the lake's oxygenation in Lake and Reservoir Management (pp. 3, 5).
What It Means If You Run or Plan an Oxygenation System
This report describes the 2012 season only. It shows both sides of oxygenation in one record: years of little anoxia once the system ran full time, and a season when outages in the weeks of highest demand let anoxia return (p. 3).
The authors' lessons are practical. The system was capable but had no significant spare capacity, so it had to run at full output through the whole stratified period. Brief stops, such as power outages, do not significantly affect the lake's oxygen, but extended down time is a concern. They recommend frequent checks and fast restarts, major maintenance in winter and low-cost remote monitoring of the compressors (pp. 3, 4). They also suggest keeping some alum for summer, because alum can still be injected when the oxygen generators or compressors are down, as long as the in-lake pump runs (p. 5).
Written up from the technical paper. Every figure is as the technical paper prints it, with the PDF page it comes from; the authors' own words appear only in quotation marks.
How to Cite
One line to paste into a report.
Barry C. Moore, Andrew Child, Benjamin Cross et al. Newman Lake 2012 Water Quality Monitoring Report. Newman Lake Flood Control Zone District, February 2013. Project engineer: Washington State University. Eco Oxygen Technologies Technical Library. https://eco2tech.com/technical-library/newman-lake-2012-water-quality-monitoring-report/
https://eco2tech.com/technical-library/newman-lake-2012-water-quality-monitoring-report/
The Next Step
Ask an ECO₂ Engineer
Questions about this technical paper, or about your own water? An application engineer answers, with the figures.